You can use this
website to download freeware applications (see links below) written by
G. Mashanov (The Francis Crick Institute, UK). This software was developed for the
detection/tracking, analysis, and modelling of single molecule dynamics (movement and binding kinetics)
in live cells, but it can be used for other purposes. You can download our
real and simulated data samples and ImageJ Plugins to import and export your data
files.
The software was
compiled using CBuilder_XE7. It will run under Win32 or Win64 OS and does not
require installation or registration:
1. Download required
.zip file (see below). The archives contain ".exe" files (32 or 64 bit), and corresponding “.dll”
files (“.bpl” libraries).
2.
Unzip these files
into selected folder on your computer.
3.
Run the required “.exe”
file.
You may manually
associate “.gmv” data files (using Windows Explorer) with GMimPro and “.gmi” files with Motility to open data files by clicking
on it. I am happy to answer your specific questions gmashanov@gmail.com but, please, read the help
files (.pdf) (and corresponding publications) first.
Yours
Gregory Mashanov
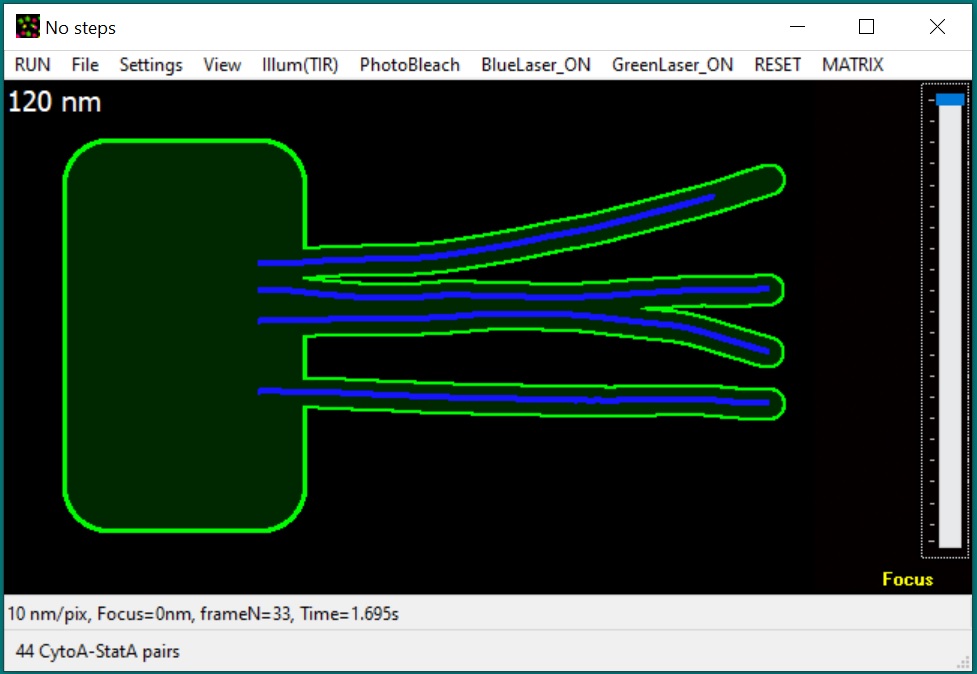 New: GMvCell is
a development of GMcellModel (see below). It is a combination of a 3D matrix
and continuum space models used to simulate complicated, randomly
shaped and placed cellular structures and some dynamic cellular
structures (e.g., moving vesicles fusing with cell membrane). Single
molecule objects (upto 50000 units of each class) move with
floating-point precision in a continuum space but only in voxels of
correct type in discrete space. Objects of the same or different
classes can interact with each other according to the
binding/dissociation rates set by operator - the probability of binding
depends on the distance/mobility of eligible pair and continuity of the
correct voxel space between these objects. During simulation model
produces sequences of fluorescence light microscopy images built
according to the simulated imaging conditions (e.g., illumination
method, microscope magnification, objective numerical aperture, and
camera settings) which can be used for data ananlysis. The model executable file (GMvCell.exe), required
libraries, help file (GmvCell-Help.pdf), pre-defined scenarios, and satellite software
(GMimPro and Motility) can be downloaded below (64bit files). Please note, this is 64bit only software because it requires large memory volume to simulate virtual cell.
New: GMvCell is
a development of GMcellModel (see below). It is a combination of a 3D matrix
and continuum space models used to simulate complicated, randomly
shaped and placed cellular structures and some dynamic cellular
structures (e.g., moving vesicles fusing with cell membrane). Single
molecule objects (upto 50000 units of each class) move with
floating-point precision in a continuum space but only in voxels of
correct type in discrete space. Objects of the same or different
classes can interact with each other according to the
binding/dissociation rates set by operator - the probability of binding
depends on the distance/mobility of eligible pair and continuity of the
correct voxel space between these objects. During simulation model
produces sequences of fluorescence light microscopy images built
according to the simulated imaging conditions (e.g., illumination
method, microscope magnification, objective numerical aperture, and
camera settings) which can be used for data ananlysis. The model executable file (GMvCell.exe), required
libraries, help file (GmvCell-Help.pdf), pre-defined scenarios, and satellite software
(GMimPro and Motility) can be downloaded below (64bit files). Please note, this is 64bit only software because it requires large memory volume to simulate virtual cell.
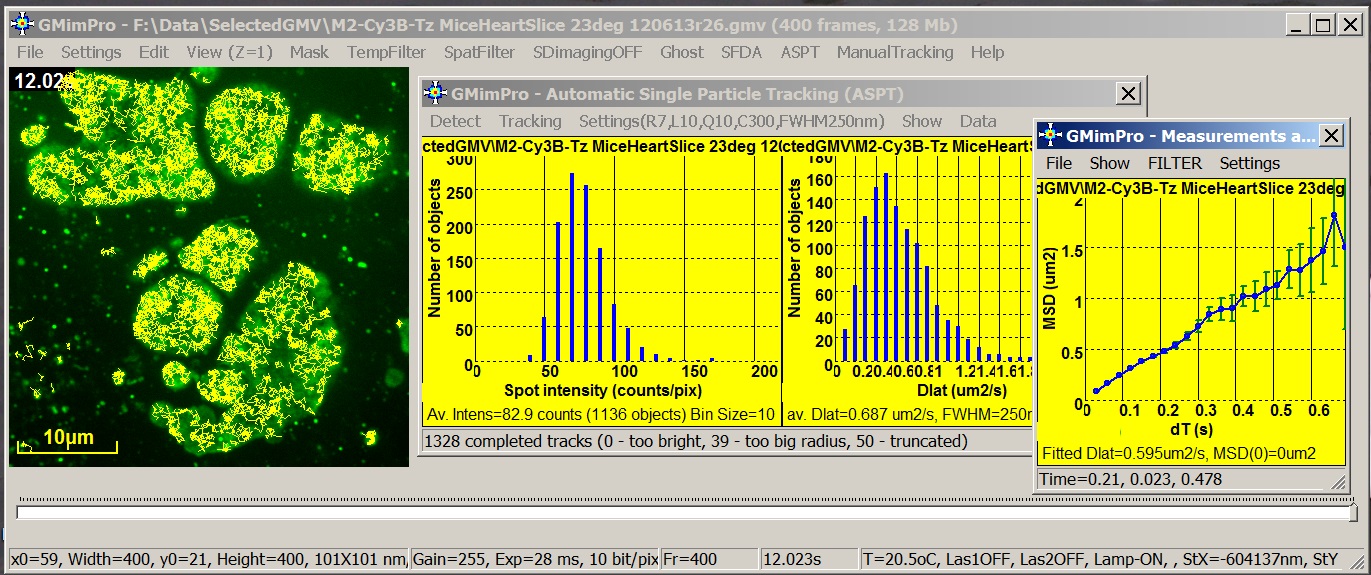 GMimPro is an image sequence processor designed for automatic
single particle/molecule detection and tracking. It can track up to 10000 objects
for up to 10000 frames. You can use ImageJ Plugins to convert your data
files into GMimPro format (“.gmv”) or import RAW data files in GMimPro (File/Import
Data). You can export the results of tracking or other measurements using
“.txt” or “.gmi” data format. See Biophysical Journal, 2007 publication for full description of the employed
algorithms.
GMimPro is an image sequence processor designed for automatic
single particle/molecule detection and tracking. It can track up to 10000 objects
for up to 10000 frames. You can use ImageJ Plugins to convert your data
files into GMimPro format (“.gmv”) or import RAW data files in GMimPro (File/Import
Data). You can export the results of tracking or other measurements using
“.txt” or “.gmi” data format. See Biophysical Journal, 2007 publication for full description of the employed
algorithms.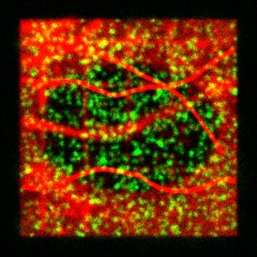 GMcellModel is a computer model simulating
mobility and binding kinetics of the single fluorescent molecules (both
cytoplasm and membrane associated) in a virtual cell. It generates a sequence of images
(8-bit “.bmp” or “.gmv” format), each containing summed images of all
fluorescent objects emitting light under given illumination conditions with
realistic levels of noise and emission fluctuations. These sequences can be
analysed by GMimPro or other imaging software (e.g., ImageJ). You
can load few basic scenarios (downloaded folder GMcellModelScenario) and run
the model to test it. See JRS Interface 2014 publication for full description of the
employed algorithms.
GMcellModel is a computer model simulating
mobility and binding kinetics of the single fluorescent molecules (both
cytoplasm and membrane associated) in a virtual cell. It generates a sequence of images
(8-bit “.bmp” or “.gmv” format), each containing summed images of all
fluorescent objects emitting light under given illumination conditions with
realistic levels of noise and emission fluctuations. These sequences can be
analysed by GMimPro or other imaging software (e.g., ImageJ). You
can load few basic scenarios (downloaded folder GMcellModelScenario) and run
the model to test it. See JRS Interface 2014 publication for full description of the
employed algorithms.
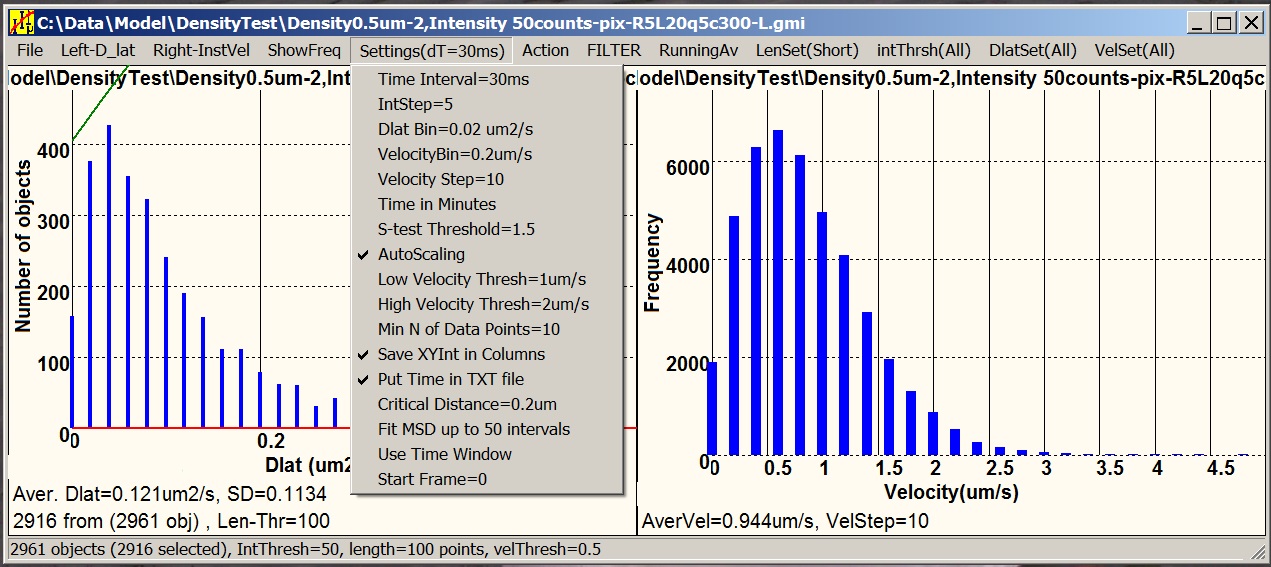 Motility is a satellite software designed
for statistical analysis of tracking data (.gmi) generated by GMimPro. You can add many
individual “.gmi” files together and create distributions of: intensity,
mobility, velocity, and other paprameters. You can create plots of average
intensity, mobility, and "distance from the origin" versus time, generate MSD
versus dT plots, and others. You can apply thresholds to separate slow-fast,
dim-bright, short-long lived objects, and so on. The graphs can be printed,
saved as “.bmp”, and exported as “.txt” files for future analysis or
publishing.
Motility is a satellite software designed
for statistical analysis of tracking data (.gmi) generated by GMimPro. You can add many
individual “.gmi” files together and create distributions of: intensity,
mobility, velocity, and other paprameters. You can create plots of average
intensity, mobility, and "distance from the origin" versus time, generate MSD
versus dT plots, and others. You can apply thresholds to separate slow-fast,
dim-bright, short-long lived objects, and so on. The graphs can be printed,
saved as “.bmp”, and exported as “.txt” files for future analysis or
publishing.
ImageJ plug-ins are written by Prof. J.E. Molloy (University of Warwick, UK).
1. Copy plugins into ImageJ
plugins folder
2. Open ImageJ and load your image
sequence
3. Input scales and time interval
to the sequence properties if needed
4. Use“GMV Writer” in “Plugins”
menu to save your data as “.gmv” file.
Alternatively you can save your data as RAW data file and use File/Import Data in GMimPro to convert data into GMimPro format (".gmv").
Download 64bit “.exe” files and libraries
Download ImageJ Plugins for GMimPro
Download GMinfectionSpreadModel
(model simulating infection spread in a structured enviroment)
GFP_inVitro - single GFP molecules attached to glass via antiGFP ab
(in vitro, TIRF microscopy)
Cy3B_inVitro - single fluorescent molecules of Cy3B dye attached to
coverslip (in vitro, TIRF microscopy)
GFP_A1_HEK - Adenosine GPCR A1
receptors (GFP tagged) at plasma membrane of live HEK cell (37°C, TIRF microscopy)
Cy3B-Tz_M1_CHO
- Muscarinic Acetylcholine
GPCR M1 receptors at plasma membrane of live CHO cell (23°C, labelled with Cy3B-telenzepine, TIRF microscopy)
Cy3B-Tz_M2_CHO
- Muscarinic Acetylcholine
M2 receptors at plasma membrane of live CHO cell (23°C, labelled with Cy3B-telenzepine, TIRF microscopy)
Cy3B-Tz_M2_HL1
- Muscarinic
Acetylcholine GPCR M2 receptors at plasma membrane of live HL1 cell @23˚C (37°C,
labelled with Cy3B-telenzepine, TIRF microscopy)
Cy3B-Tz_M2_HeartSlice
- Muscarinic
Acetylcholine GPCR M2 receptors at plasma membrane of ex-vivo mice
heart slice (23°C, labelled with Cy3B-telenzepine, TIRF
microscopy)
GFP_KCNQ1_HEK - KCNQ1 potassium channels. GFP
tagged at plasma membrane of live HEK cell (37°C, TIRF microscopy)
 Mashanov,
G.I., Tacon, D., Knight, A.E., Peckham, M., and J.E. Molloy. (2003)
Visualizing single molecules inside living cells using total internal
reflection fluorescence microscopy. Methods,
Academ. Press., 29:142-152.
Mashanov,
G.I., Tacon, D., Knight, A.E., Peckham, M., and J.E. Molloy. (2003)
Visualizing single molecules inside living cells using total internal
reflection fluorescence microscopy. Methods,
Academ. Press., 29:142-152.